US labour market: A concerning lack of churn?
Insights
For most of the past four years, the post-pandemic US labour market has been characterized by its remarkable dynamism.
Following the unprecedented disruptions triggered by the pandemic, firms hired new workers at a record pace as workers quit their jobs at record rates. Some of this surge in labour market dynamism, as evidenced by record churn, was expected to be structural. More recently, the economy added nearly 3 million jobs over the past year, in part reflecting the absorption of a significant positive supply shock via large immigration inflows.
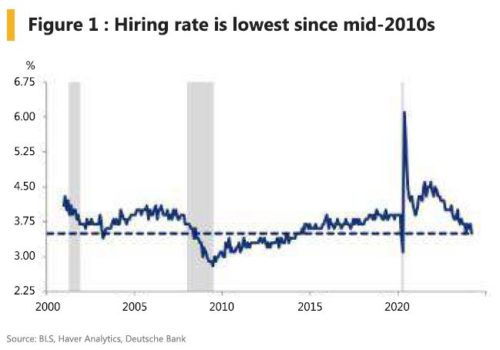
However, despite continued robust job gains, there are considerable signs that the dynamism of the US labour market is in retreat. Indeed, measures of labour market churn have fallen substantially. As the latest JOLTS data demonstrate, the hiring rate is the lowest since 2014, the quits rate is the lowest since 2018 and the layoff rate remains near record low levels (Figures 1-3). In other words, robust net job gains are being powered by a lack of dynamism, as a relatively tepid hiring pace can more than keep up with a similarly tepid pace of separations.
The private sector quit rate released on Thursday declined to 2.3% (3m moving average of 2.4%), confirming the trend in place over the last two years of a 0.10% reduction per quarter. Pre-covid, a private sector quit rate of 2.3% was consistent with an unemployment rate above 4.5% (using 3m averages). The historical relationship between the quit rate and the unemployment rate was significantly distorted during covid.
Some of the drivers behind the distortion (reduced labour mobility, more generous unemployment insurance, significant excess savings) are arguably no longer valid. If the covid distortions are truly behind us, there should be upside risks to the unemployment rate in Q2.


Consistent with this notion of fallen dynamism, an aggregate measure of labour market churn (total hires plus total separations as a share of the labour force) has fallen to the lowest levels since 2015 (Figure 4). Decreased dynamism typically would be associated with a substantially looser labour market. As shown in Figure 5, the correlation between the measure of churn and the unemployment rate was 90% from 2000 up until the pandemic.


Based on the current depressed level of churn, we would expect an unemployment rate that was above 5%, not one that is still reasonably stable near historically low levels (3.90% based on April 2024 unemployment rate).
So, what is causing this apparent disconnect between labour market churn, which suggests the labour market could be looser, and the most popular summary measure of labour market slack, which along with elevated wage inflation suggests the labour market remains reasonably tight? This question deserves a deeper analysis than we provide in this debrief, but below are a few possibilities.
- Labour hoarding: Given the difficulty finding workers following the large layoffs around the pandemic, at least some firms are likely to be more reluctant to lay off workers. This would be consistent with a historically low layoff rate and subdued average workweek but would not necessarily fit with recent strong productivity gains.
- Difficulty finding workers: An inability to find suitable workers could also be depressing the hiring rate. The vacancy yield, hires divided by job openings, remains historically low, consistent with this idea. This would fit with elevated wage growth. However, data from the NFIB suggests this is less likely to be a major factor.

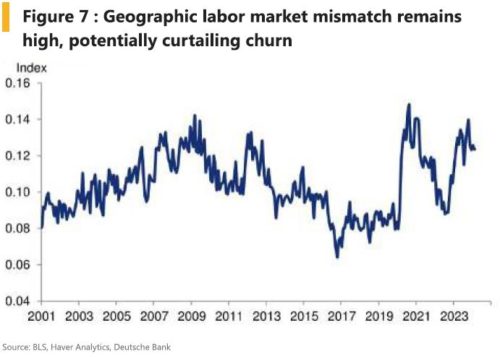
- Housing lock: Elevated mortgage rates may be curtailing household relocations that could be needed to quit a job or accept a different employment opportunity. This could depress the quits rate and hiring rate and keep wage growth elevated. Consistent with this, a geographic labour market mismatch index, which captures a dislocation between job openings and unemployment across states, has been historically elevated.
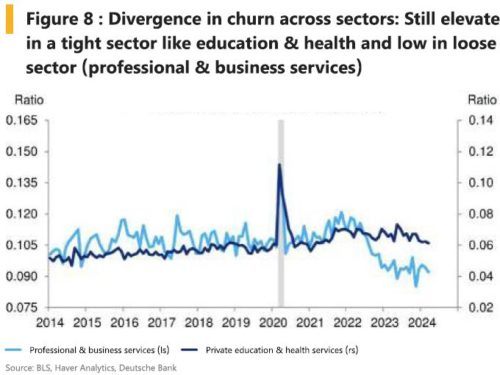
- Continued normalization from Covid (cross-sector heterogeneity): Some sectors could be experiencing pent up demand and still difficulty finding workers (e.g., health care, education, government), which leaves these sectors as a key driver of employment gains and would keep the labour market tight from an aggregate perspective. Indeed, these sectors accounted for ~60% of job gains over the past year. Conversely, professional and business services, which in late-2022 / early-2023, had employment levels 1% above the pre-covid trend, essentially has the lowest churn rate since the aftermath of the GFC.
- Positive labour supply shock: The biggest surprise for the US economy over the past year has been a surge in labour supply driven by net immigration, so it would be surprising for this to not affect labour market churn data. By filling job openings, perhaps this has reduced the job switching premium, though this would require that job openings are overstated. Or, perhaps, foreign born workers are less likely to undertake job-to-job transitions, which is leading to a lower quits rate.
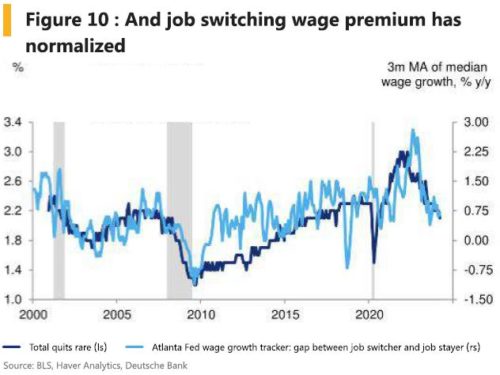
- Optimized matches: A final possibility is that an initial surge in labour market churn in 2022 and into 2023 led to improved matches between employers and employees which now have less reason to dissolve this better match, either voluntarily or involuntarily. This would be consistent with the compressed wage premium for job switchers and the surge in productivity over the past year.

Disclaimer

The documents herein are issued for general information purposes only. Views and opinions contained herein are those of Bordier & Cie. Its contents may not be reproduced or redistributed. The user will be held fully liable for any unauthorised reproduction or circulation of any document herein, which may give rise to legal proceedings. All information contained herein does not constitute any investment recommendation or legal or tax advice and is provided for information purposes only. Please refer to the provisions of the legal information/disclaimer page of this website and note that they are fully applicable to any document herein, including and not limited to provisions concerning the restrictions arising from different national laws and regulations. Consequently, Bordier & Cie does not provide any investment service or advice to “US persons” as defined by the regulations of the US Securities and Exchange Commission, thus the information herein is by no means directed to such persons or entities.

© 2020 Bordier Group and/or its affiliates.