The End of the Affair
It was nice while it lasted. The tattered posters on the cover show the remnants of some equity market catalysts over much of the last decade and in particular 2020-2021: profitless innovation, the Fed’s quantitative easing, the discredited Western conceit of “geopolitical change through trade”, the cocktail napkin appeal of Modern Monetary Theory and massive fiscal stimulus, unsustainable negative real interest rates and “TINA” (there is no alternative to equities), the dream sequence of a rapid transition to renewable energy, the Potemkin village of Metaverse narrative and the pseudo-libertarian gibberish of unregulated crypto.
The largest combined monetary and fiscal experiment in history is ending now, and a major growth slowdown is coming to the US and Europe. But: avoid the trap of becoming more bearish the lower the market gets, and be prepared to take advantage of selloffs when/if they occur. In the history of US recessions (with the exception of the dot-com collapse of 2001), equity markets bottomed well before the bottom in GDP, payrolls, S&P 500 earnings and housing starts and the peak in household/corporate delinquencies. The ISM survey has been the most reliable coincident indicator of a bottom in equities, which is why we pay so much attention to it. If history is any guide, the equity bottom would also coincide with the end of Fed hikes. We expect equity markets to bottom sometime in the first half of this year, the October 2022 lows might be tested again.
Our outlook begins with a discussion of leading indicators and what equity markets are pricing in already. The sections that follow examine US inflation which we believe will cool enough for the Fed to pause around 5% in the Spring. We will then touch on some fundamental of the loan market and to conclude we will give a brief overview of what to expect in China.
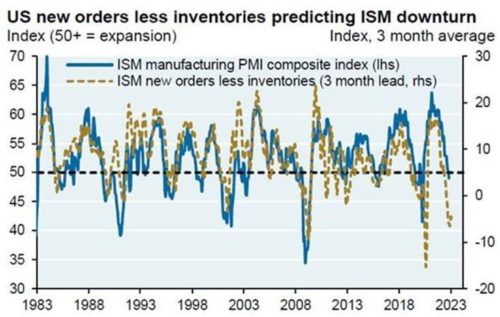
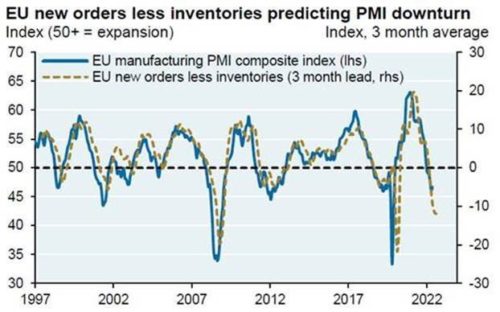
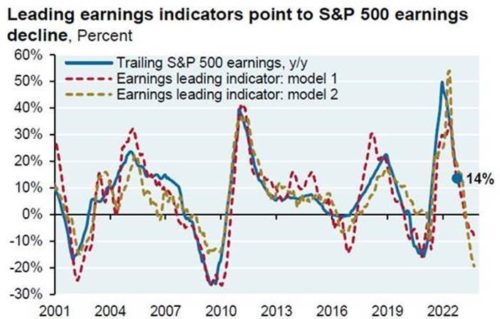
Leading indicators suggest that a major growth slowdown is coming to the US and Europe. Whether a recession technically occurs or not is beside the point; for equity investors, the slowdown ahead is likely to drag corporate profits down with it. We track manufacturing surveys closely since they’re good coincident indicators of a bottom in equity markets when recessions do occur. The first two charts predict where these surveys are headed given rising inventories and falling new orders. We expect a bottom in these manufacturing surveys in Q1/Q2 of 2023, and at levels that are above 2008 and 2020. In other words, if there is a recession, we expect it to be a milder one than the last two. The third chart projects the decline in S&P 500 earnings. Our best guess is 10% to 15% y/y decline in S&P earnings in 2023. In Europe, consumer spending is declining as energy crowds out other forms of consumption. While European governments are shielding consumers from peak gas and electricity prices, households will still face substantial energy bill increases in 2023, negatively impacting employment, housing and production. Core inflation in Europe is still running at 5%, forcing the ECB to tighten into economic weakness.
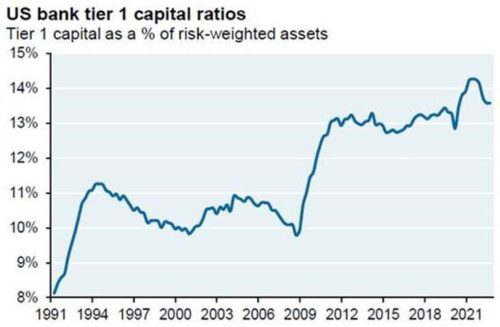
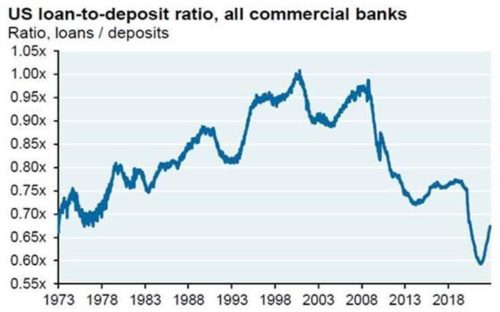
Whenever growth slows materially, we examine the effects on the banking system since that’s where losses are magnified due to leverage and depositor risks. The situation looks much better than 2008. US bank tier1 capital ratios have risen substantially. A lot of risky lending migrated from banks to capital markets and private credit lenders. US bank wholesale funding is now 7.5% of bank liabilities, down from 17.5% in 2000; and loan to deposit ratios fell from 1.00x in 2008 to ~0.65x, the most liquid the US banks have been since the 1970’s. Here’s the “but”. Due to rising rates, a lot of deposits fund high-quality bonds that trade below par, designated as “Available for Sale” or “Hold to Maturity”. Unrealized losses on these securities at US banks have ballooned to ~$700 billion.
US Central Bank
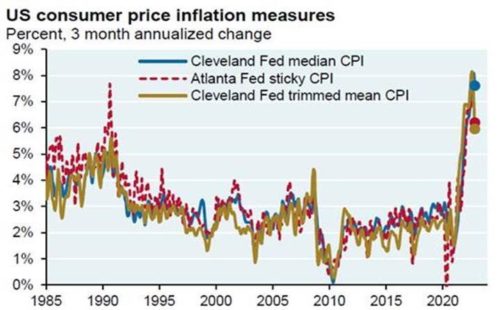
Inflation pressures are expected to subside in 2023 and allow the Fed to pause around 5% to see where things go from there, and expect the 10 year US Treasury to remain below 4%. Inflation expectations derived from 10 year TIPS markets are back down at 2.25% from their 3% peak, so the Fed should be able to claim victory on that front after the fastest tightening cycle on record. If inflation cools as much as markets expect, it would be quite unusual: The average developed market inflation spike takes longer to recede. The challenge for the Fed is more related to wages than prices. By some measures, the US has been facing the tightest labor market on record: the highest job shortages in the post-war era, the lowest “job fill” rate, the largest premium for job switchers vs job remainers, etc. Wage growth is beginning to roll over based on measures we look at. So far, the largest layoffs have been in tech and homebuilding; layoffs ex-tech and homebuilding are still at the lowest level in 20 years [according to Challenger data].
The labor shortage is a consequence of COVID, above-average rates of retirement and a slowdown in immigration. Labor force participation rates are actually back to pre-COVID levels for people under the age of 55. It’s mostly the 60+ cohort that hasn’t come back to work, and there are few signs that they are planning to return. On immigration: while there was an increase in visa issuance in late 2022, the US economy is still affected by the trough in immigration that occurred during COVID. The goods inflation picture has improved dramatically: supply chain pressures in warehousing and transport have cooled, and used car prices have further to fall. After surging to 15% y/y increases during COVID, US durable goods inflation is now roughly 0% with the potential for deflation in early 2023. US new car inventories reached 1.6 mm units in December 2022 according to Cox Automotive, up ~80% from 0.9 mm units in September 2021 but still well below the 2019 average of ~3.7 mm. We also expect the household demand impact on inflation to slow given further depletion of US excess savings, which peaked at ~$2.1 trillion in the middle of 2021. These savings have been drawn down to around $1.1 trillion, and should be fully depleted by mid-year.
The elephant in the room on inflation in the short term is housing, which represents the largest component of core inflation. Housing costs in the CPI data are lagged: home price and rental increases of the last couple of years Are showing up now in the CPI data. However, current measures such as apartment asking rents are slowing significantly. This makes sense given the sharp rise in mortgage rates and the largest percentage increase in multifamily Units coming online since the 1970’s. In other words, the collapse in housing (whose speed now rivals the housing decline during the double dip recession of the 1980’s) should dampen inflation substantially in 2023.
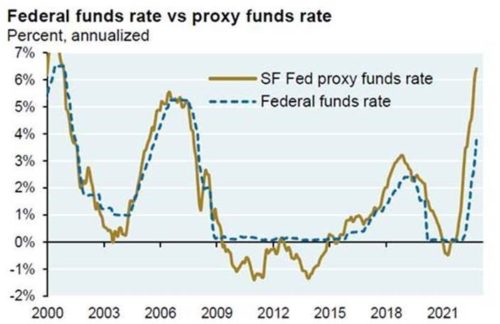
Bottom line: inflation should cool enough for the Fed to pause around 5%. Remember, it’s not just the policy rate that’s changing; the Fed’s balance sheet is shrinking as well. The SF Fed computes a “proxy rate” that takes into account the impact of QE unwinding and related market impacts. This proxy rate is now higher than the Funds rate by the highest margin on record, another reason why we believe that inflation will slow meaningfully in 2023.
Loan market
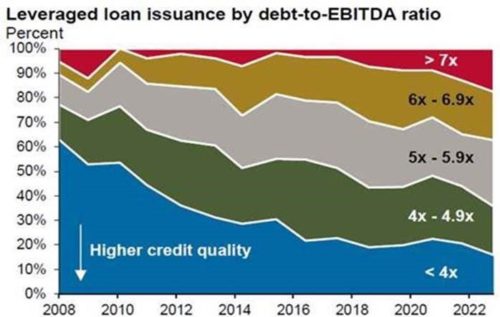
One concern as we head into a possible recession: the minimal repricing of leveraged loans after a decade of declining investor protections and rising leverage. Areas of deterioration include diminishing lender rights and protections. Loan investors have surrendered at a record pace, a sacrifice the Fed could be held partially accountable as financial repression caused people to lose their investment bearings. Many of the same concerns relate to the private credit market, which at $1.2 trillion is the same size as US high yield. One reason for declining protections: on some transactions, financial sponsors instruct banks arranging their syndicated leveraged loans as to which law firm the bank should use as its own counsel, a practice known as “sponsor-designated counsel”. You get what you pay for.
Loan investors relaxed criteria regarding leverage and interest coverage maintenance tests, most favored-nation provisions, mandatory prepayments from asset sales, exceptions to negative covenant restrictions, restricted payments clauses, definition and scope of allowable EBITDA adjustments, leakage of assets from the collateral pool, caps on investments in or transfers to unrestricted subsidiaries and affiliates, the ability to add senior pari-passu or priority debt, lien dilution by non-guarantor subsidiaries, etc. EBITDA adjustments refer to the practice of companies adding back non-recurring expenses and assumed merger synergies/cost savings to earnings, thereby enhancing coverage ratios. According to S&P, the use of EBITDA add-backs increased from 10% of all deals to ~30% by 2019. In terms of magnitude, S&P reports that such add-backs range from 10%-15% of unadjusted EBITDA. However, according to Moody’s, some deals allow add-backs up to 20%-30% of unadjusted EBITDA, and some deals have no caps at all.

China
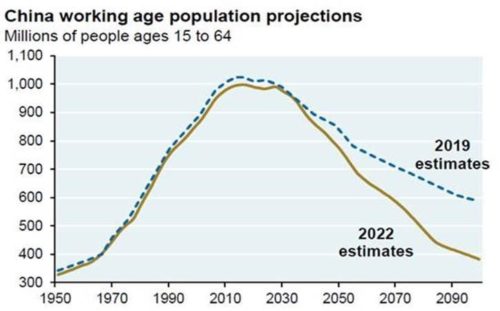
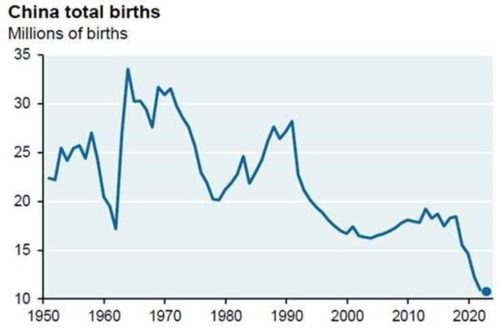
Pandemic restrictions, falling consumer spending and a collapsing property market have hit China hard. This year is expected to be the first time in three decades that most Asian economies will grow faster than China. We remain puzzled as to why China never made an arrangement with Moderna or Pfizer for their mRNA vaccines, which have higher efficacy than China’s attenuated virus vaccines. As of December 2022, one-third of China’s 267 million people over age 60 hadn’t received their third Sinovac or Sinopharm vaccine booster dose. In any case, China is now reopening and accepting greater health risks in the process. An issue that may have affected the decision to reopen: the collapse in Chinese births and implications for future growth, illustrated below. A recovery cannot come soon enough for investors in China. After years of market-friendly policies, MSCI increased China’s weight in the Emerging Markets Equity Index to 40% by 2020, which drew in more foreign capital. Shortly thereafter, Xi’s “progressive authoritarianism” campaign began, ushering in the largest underperformance of Chinese vs world equities on record (-50%).
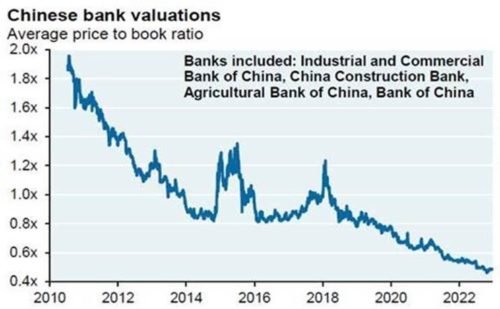
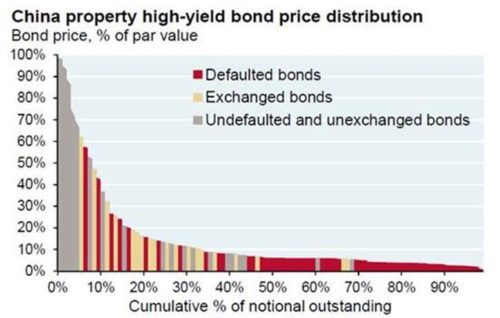
On December 26, 2022 China accelerated its reopening by removing quarantine for domestic infections, abandoning contact tracing and risk district classification systems, eliminating frequent testing/quarantine for inbound travelers and allowing people that test positive to go to work. China was close to deep value pricing by November of last year. Equity earnings yields ranged from 11%-12% (close to Global Financial Crisis levels), and China banks still trade at less than 0.5x book value. On property markets, there’s an enormous amount of bad news priced in as shown in the below chart: only about 10% of China’s high yield property bond universe is priced above 60% of par value, and a startling 85% of the universe is trading at or was exchanged at less than 20% of par value. Once markets reach the “how much worse can it get” phase, marginal improvements in policy or macro can lead to a sharp improvement in asset prices. The latest measures for the Chinese property market include a central bank relending program and the lifting of restrictions on equity market and shadow finance fundraising. And while the connection between household conditions and spending is not as clear as in the US, Chinese households are flush with cash: deposits are up 60% vs pre-COVID levels, and mortgage rates are back down to where they last were in 2017.
Conclusion
There seems to us that global investors might have more visibility in China Vs Developed Markets, at least during the first part of the year. Asset evaluation differentials as well as Central banks asymmetric dynamics should be supportive in China and will probably become less restrictive later this year in Developed markets as inflation finally subside. In the credit market, we still favor quality corporates bonds Vs high yielding securities, as slowing economies, coupled with positive real yield later this year on top of corporate earnings revisions, could push rating agencies to take negative actions on over leverage companies, which might lead to further credit spreads widening moving forward.
Disclaimer

The documents herein are issued for general information purposes only. Views and opinions contained herein are those of Bordier & Cie. Its contents may not be reproduced or redistributed. The user will be held fully liable for any unauthorised reproduction or circulation of any document herein, which may give rise to legal proceedings. All information contained herein does not constitute any investment recommendation or legal or tax advice and is provided for information purposes only. Please refer to the provisions of the legal information/disclaimer page of this website and note that they are fully applicable to any document herein, including and not limited to provisions concerning the restrictions arising from different national laws and regulations. Consequently, Bordier & Cie does not provide any investment service or advice to “US persons” as defined by the regulations of the US Securities and Exchange Commission, thus the information herein is by no means directed to such persons or entities.


© 2020 Bordier Group and/or its affiliates.