Japan’s Economy: Breaking free 3 decades of stagnation
“Success is not final, failure is not fatal: It is the courage to continue that counts.”
– Winston Churchill
Insights
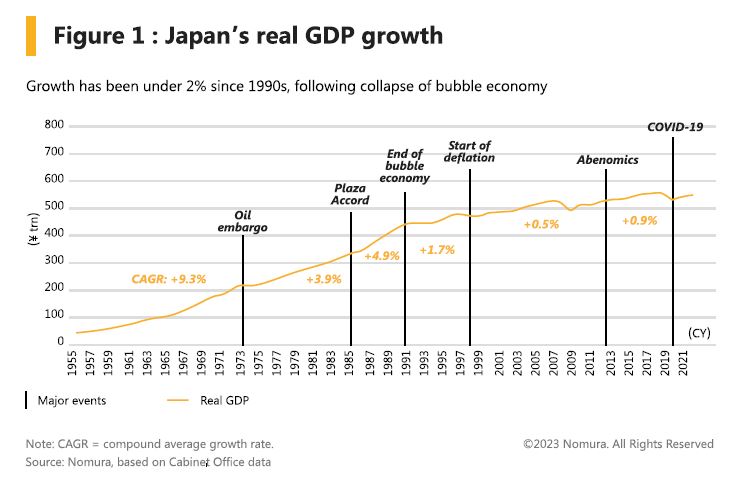
Japan’s Three Lost Decades started off with the 1985 Plaza Accord, a joint agreement between France, Germany, the U.K, the U.S and Japan to manipulate exchange rates by depreciating the US Dollar relative to the Japanese Yen and the German Deutsche mark.
The intention of the Plaza Accord was to correct trade imbalances between the US-Germany, and US-JP, but it corrected only US trade balance. This led to the dramatic appreciation in yen and Deutch mark relative to the dollar, and paved the way for Japan’s decades of sluggish growth and deflation. Amid concern that the stronger yen might lead to an economic downturn, the Bank of Japan (BoJ) engaged in monetary easing and contributed to the formation of the bubble economy. Between 1985 and 1991, the Japanese economy benefited from low inflation despite the sharp rise in asset prices, fuelled partly by the fall in crude oil prices. However, the stock market and land prices started to fall after peaking at end 1991. This marked the collapse of the bubble and start of the period known as the “Three Lost Decades”.
As land prices continued to fall, the problem of nonperforming loans (NPLs) at financial institutions increased, resulting in a series of bankruptcies at major financial institutions. In 1997, Japan experienced a rise in the consumption tax rate from 3% to 5%, coinciding with the onset of the Asian currency crisis during that summer, which exerted downward pressure on the Japanese economy from multiple angles.

Japan officially entered a period of deflation in 1998, with negative GDP deflator growth.
In 1998, the BoJ ushered in a new era of independent and transparent policies under the revised Bank of Japan Act. This period witnessed a gradual reduction in policy rates throughout the 1990s, culminating in the introduction of a zero-interest rate policy in 1999, signalling the onset of unconventional monetary measures. Following the bursting of the US IT bubble in 2001, the BoJ introduced quantitative easing as a response, even after terminating its zero-interest rate policy in 2000.
During this time, Japan faced significant downward pressure on wages, driven by shifts in workforce dynamics, notably the increase in part-time employment. Base pay stagnated around 2002, partly due to concerns about Japan’s competitiveness in the global market. China’s integration into the global economy further exacerbated deflationary pressures by supplying cheap labor, prompting a shift in Japan’s traditional employment paradigm towards more stability.
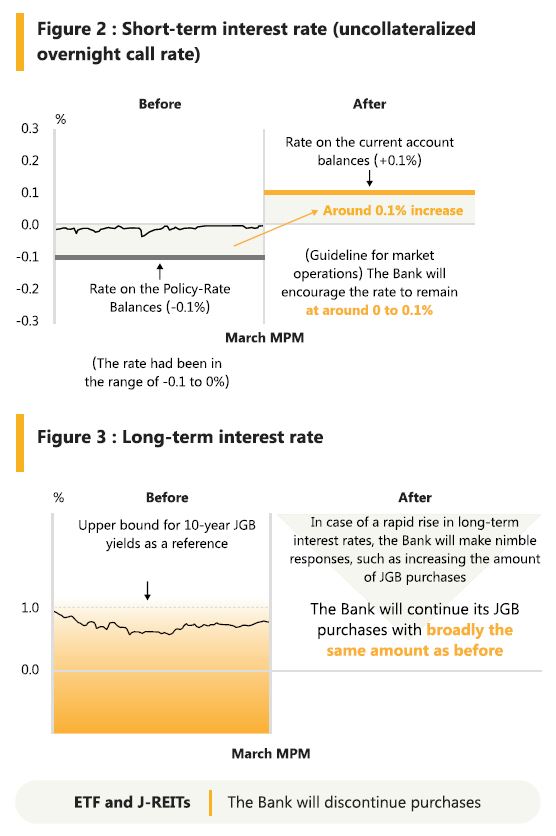
The financial crisis of the late 1990s concluded in 2003 with the injection of public funds into Resona Holdings, marking the beginning of the Izanami Boom, Japan’s longest postwar economic expansion. Despite this growth, limited recovery in private consumption persisted, with Japan increasingly reliant on exports, especially to China. The global financial crisis of 2008 exacerbated Japan’s economic challenges, leading to renewed deflationary pressures alongside the strengthening yen and weakened demand, ultimately prompting the BoJ to implement comprehensive monetary easing measures, under which it started purchasing long-term JGBs, corporate bonds, commercial paper, ETFs, and REITs. Negative interest rates and yield curve control policy were further introduced in 2016. Fast forward to today after the pandemic Covid-19, the combination of strong demand and supply chain disruption led to further upward pressure on global inflation, including Japan. Coupled with widening interest rate differential between Japan and the rest of the world, yen depreciation reached extreme level contributing to high imported inflation. In March 2024, the BoJ judged it came in sight that the price stability target of 2% would be achieved in a sustainable and stable manner, exiting deflation. It decided to terminate its negative interest rate policy, yield curve control, the overshooting commitment on the monetary base, and ETF and J-REIT purchasing, reverting back to a “normal” monetary policy framework. This came after the announcement of the high wage growth in 33 years, after Japan’s biggest companies agreed to raise wages by more than 5% for 2024. In addition, recent data and anecdotal information have gradually shown that the virtuous cycle between wages and prices has become more solid.

Impact of BoJ monetary policy change
Although this policy change has a symbolic meaning as a nearexit step of aggressive monetary easing, its direct and immediate impacts on financial markets and the Japanese economy are small. First of all, “BOJ emphasised that ‘accommodative financial conditions will be maintained for the time being’ in its policy statement. This phrase, with the decision of continuing QE, is generally taken by market participants as a dovish sign that a move for the next interest rate hike will not be near and rate hike path would be gradual. This can be seen from the USDJPY movement where it rose in reaction to BoJ’s announcement. the forex markets had already priced in a change in monetary policy at the BoJ, including the recent rate hikes, and the announcement was therefore no surprise. Because Japan was the only major country that continued to have negative interest rates, and due to the fact that attention was drawn from changes in corporate governance and as well as an exit from longstanding deflation, investors have already factored in the detailed changes in the Bank of Japan’s behaviour.
Japan stands at an inflection point where the nominal growth trend shifts up. After an above 5% surge in 2023, Japan’s nominal GDP growth is expected to remain solid close to 4% in 2024 on the back of sustained domestic inflation accompanied by wage growth, and solid real growth led by domestic demand. This is a momentous shift for Japan, where nominal growth had been in a flat range for decades, to escape from “the Lost Decades” because a larger overall economic pie can allow simultaneous growth for both workers and firms. An upward shift in Japan’s nominal growth should positively affect asset prices, including equity prices.
In addition, persistent deflation or low inflation has historically hindered household investment in risk assets, with both households and corporations tending to prioritize cash and deposits over riskier ventures. This inclination towards hoarding cash is accentuated in environments with deflationary expectations, discouraging long-term investments in domestic equities and promoting short-term speculative trading. The allocation of equity and investment trusts within total assets demonstrates a significant correlation with inflation rates, exemplified by Japan’s shift towards accumulating safer assets amidst prolonged deflation and low nominal growth post the late-1980s asset bubble collapse. Notably, as of 2023, over 50% of financial assets held by Japanese households comprise cash and deposits. Sustained increase in inflation expectation should increase allocation to domestic equities investment from household.
New NISAs to play a key role in shifting households’ asset allocation
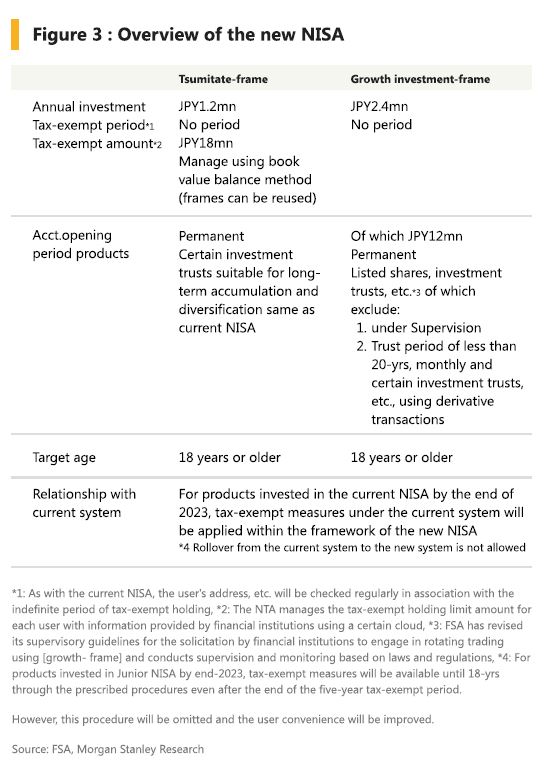
Japan’s Nippon Individual Savings Account (NISA), launched in 2014, is a scheme designed to promote investments by exempting the 20% tax levied on dividends and capital gains for individuals’ security holdings. The new NISA (Nippon Individual Saving Account) system launched in Jan 2024. The heart of the national strategy is to embed a culture of long-term investing within Japanese behaviour patterns, making it the starting point of household securities investment.

The following four points cover the main changes from the old NISA: (1) Expanded annual investment frameworks (general NISA accounts have been expanded from ¥1.2mn to ¥2.4mn for the growth investment framework, and tsumitate NISA accounts, as a cumulative investing framework (a more long-term, savingstype vehicle), have been expanded from ¥400,000 to ¥1.2mn). (2) Growth investment and tsumitate investment frameworks can be used together. (3) Increased tax-exempt holding limits (the limits were ¥6mn for general NISA accounts and ¥8mn for tsumitate NISA accounts, but the limits have been expanded to ¥18mn for the tsumitate investment framework, of which ¥12mn for the growth investment framework). (4) The tax-exempt holding period has been made indefinite and the NISA system permanent.
The impact of NISA has exceeded expectations, with significant growth observed in account openings and investment volumes. According to data from the Japan Securities Dealers Association (JSDA), the number of new NISA accounts opened via securities brokers tripled in scale, reaching 530,000 in February alone. Additionally, the average monthly purchasing of growth investment and systematic “tsumitate” investment in January- February was approximately 3.3 times higher than the monthly average for the same period in the previous year.
These figures outpaced even the most optimistic forecasts, with the average purchasing in January-February representing an annualized ¥21.24 trillion, significantly higher than the anticipated ¥6.7 trillion. Notably, 90% of equity purchases made through NISA were in domestic stocks, indicating a strong preference for Japanese stocks among investors. This surge in investment underscores a positive shift in household sentiment towards both NISA and Japanese equities, surpassing expectations and signalling a promising outlook for the Japanese stock market.
In conclusion, Japan’s recovery narrative represents a significant turnaround for the world’s third-largest economy. In Bordier Singapore, we maintain an optimistic outlook on Japan’s trajectory and offer a curated list of recommended Japan funds and direct stocks. Interested parties are encouraged to approach our investment team for further information.
Disclaimer

The documents herein are issued for general information purposes only. Views and opinions contained herein are those of Bordier & Cie. Its contents may not be reproduced or redistributed. The user will be held fully liable for any unauthorised reproduction or circulation of any document herein, which may give rise to legal proceedings. All information contained herein does not constitute any investment recommendation or legal or tax advice and is provided for information purposes only. Please refer to the provisions of the legal information/disclaimer page of this website and note that they are fully applicable to any document herein, including and not limited to provisions concerning the restrictions arising from different national laws and regulations. Consequently, Bordier & Cie does not provide any investment service or advice to “US persons” as defined by the regulations of the US Securities and Exchange Commission, thus the information herein is by no means directed to such persons or entities.

© 2020 Bordier Group and/or its affiliates.


