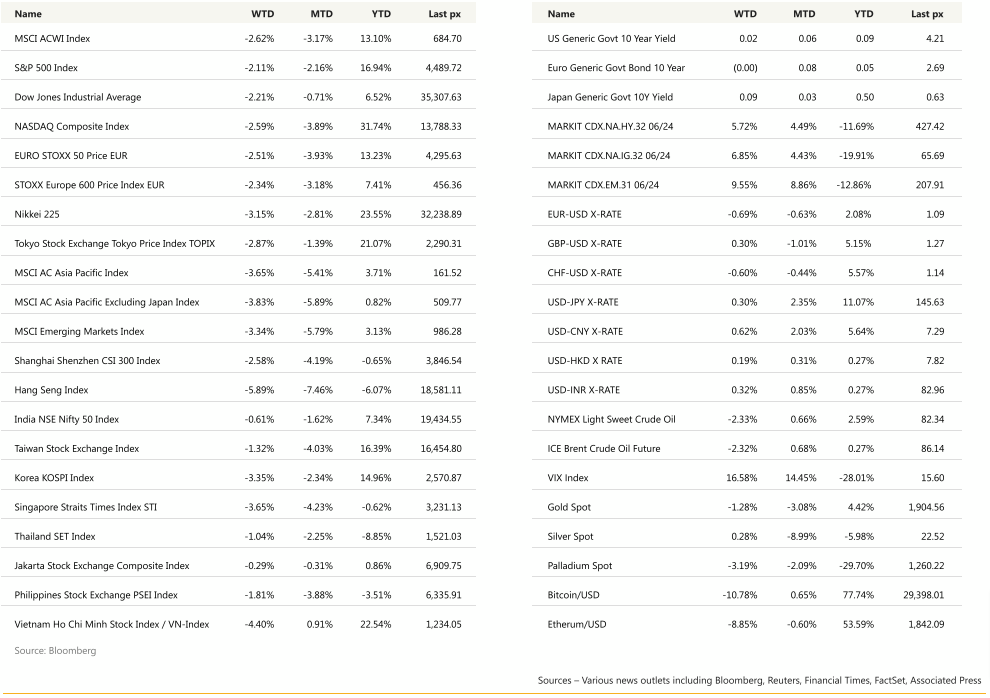
KEY MARKET MOVES

MACRO OVERVIEW
Global
US Tech recorded its worst weekly losing streak this year as higher longer term yields and Chinese economic challenges weighed on overall sentiment. US stocks recorded its 3rd consecutive week of losses as good news still spelled bad news for risk assets.
Retail sales, housing starts and industrial production data all beat expectations. Resilience in the US have spurred bets that the Fed could keep rates higher for longer and any cuts keep getting pushed back. The US 10-year Treasury yield rose to its highest level since November at 4.25% whilst the 2-year was less volatile, remaining below 5% which it briefly pierced earlier in the week. Goldmans is the latest to officially “pencil in” a rate cut in Q2 of 2024. The last FOMC minutes showed officials saw “significant” upside risks to inflation and considered further rate increases although a couple of members preferred a pause to allow the cumulative effects of rate hikes unwind into the broader economy. But overall, our read on the minutes weren’t all that surprising given Powell’s post-meeting press conference. The “significant” element in our view, appears relative when multiple indicators are pointing to disinflationary processes in place. This week will see S&P US Global manufacturing, services, composite readings together with U. of Mich. Sentiment and inflationary expectations.
The major event for the week is Wyoming’s Jackson Hole symposium. Observers are split with what Powell may allude to. One camp (c. DB) says the Fed is comfortable with higher rates as recent data suggests US economic growth is too strong whilst the other says the Fed cant really afford to see this yield keep going up so, they need to calm bond markets down (c. Yardeni). The most likely outcome would be Powell striking a more balanced tone perhaps hinting at the tightening’s end while reinforcing the need to hold rates higher for longer.
Risk-off sentiment kept the USD on its front foot, pressuring precious metals and cryptos. Taking advantage of USD strength to selectively build up Euro and Gold longs.

Asia
MSCI’s Asia-Pacific ex Japan shares dipped 3.8% last week. Japan’s Nikkei was lower by 3.2%. China took the largest beating, Hang Seng closing lower by 5.9%, CSI 300 -2.58%.
This morning, Chinese stocks tumbled again after China delivered a smaller cut to lending rates than markets had counted on, continuing Beijing’s run of disappointing stimulus steps. China’s central bank trimmed its one-year lending rate by 10 basis points and left its five-year rate unmoved, a surprise to analysts who had expected cuts of 15 basis points to both. Last week, PBOC had surprised with a 15 bp cut to the 1y MLF ( Medium-Term Lending Facility Rate) rate to 2.50% as consensus expected no change. Last Friday evening, China’s securities regulator announced a series of reforms designed to boost investment in its capital markets, including encouraging share buybacks to stabilise prices and cutting transaction fees for brokers.
Beijing has stopped short of unleashing major stimulus despite months of disappointing economic data. China Retail sales grew 2.5% versus consensus estimates of 4.5%. Consumer prices slipped into deflationary territory in July and growth of just 0.8% in the second quarter against the previous three months.
China home sales by value rose 0.7% y/y in Jan-Jul period versus 3.7% in the Jan-Jun period. Property investment fell 8.5% Jan-Jul versus 7.9% decline in Jan-Jun. New construction starts fell 24.5% y/y in same period versus a 24.3% decline in first six months. The NBS said risks for property developers could be gradually resolved given “policy optimization”.
China gloom saw the Australian and New Zealand dollars, often used as liquid proxies for the yuan, tumbling to their lowest levels since November in early Asia trade. The Aussie bottomed at $0.6365, while the kiwi slid to a low of $0.5903.
Japan’s gross domestic product grew at an annualised rate of 6% during the April-June period, significantly higher than the 2.9% consensus estimate of economists. Exports expanded by 3.2% in the second quarter. Car sales abroad were helped by the fading impact of supply chain disruption, while inbound tourism, whose contribution to GDP is included in net export figures, has returned to more than two-thirds of pre-pandemic levels. Foreign arrivals are expected to continue to grow after China last week ended restrictions on group tours to several countries including Japan.
South Korea will expand financing support for exporting companies by around 50% more this year, the financial regulator said on Wednesday. Specific measures include expanded credit and lower borrowing costs for companies entering new markets, bidding for overseas project orders, and making investment in major industries such as semiconductor, rechargeable battery, biopharmaceuticals and nuclear energy. The measures are aimed at supporting a recovery in exports as well as improvement in mid- and long-term competitiveness of exporting companies. South Korea’s July exports fell for the 10th straight month and at the steepest pace in more than three years, raising concerns that the downturn may drag on longer than expected amid weak demand.
CREDIT/ TREASURIES
Early last week, global government bonds printed in the red, confronted with headwinds in the form of strong UK wages data, robust US retail sales, and a re-acceleration in Canadian CPI, whilst European natural gas prices (+13%) saw a fresh spike amidst a strike at an Australian LNG facility. Within the rates space, the intraday range was wide. While a firm retail sales print pushed 2Y yields above 5% briefly, the subsequent risk off drove yields as low as 4.90%.
While inflation has been more encouraging of late, activity data that’s still strong might encourage the Fed to keep a hawkish bias as we move towards the September meeting. Powel also added that Fed QT could continue alongside rate cuts if those cuts come amid a soft-landing. Implicit in his framing is that QT will end if the Fed is cutting rates to actively ease the stance of policy in response to recession. Recession next year remains a possible scenario and therefore QT could end by mid-2024. But recent data suggest material odds of a soft-landing, which would extend QT by around one year and $700 to 900bn. Based on estimates of the effects of decrease in Fed securities holdings, a full pricing in of that shift would raise 10y term premia by roughly 15-25bp.
Robust US data and fresh signs of inflationary pressures sent global yields up to new highs. Most notably, the 10yr US Treasury yield rise another +4bps to 4.25%, which is its highest closing level since 2008. Fed futures now pricing in a 45% chance of a further hike by the November meeting.
The US Treasury curve steepened last week with the 2years up 4bps, 5years up 7bps, 10years up 9bps & 30years up 10bps. In term of performance US IG lost 0.90%, US HY lost about 1% and leverage loans were unchanged. Credit spread on IG widened by 5bps over the week while HY spreads widened by 26bps.
This week main event will be the Jackson Hole central bankers meeting as well as the US August Manufacturing & Services PMI’s and the August University of Michigan sentiment Index.
FX
The EUR/USD break through 1.093/1.098 moving average and Jun-Jul trend line support extends the decline from the 1.1275 Jan 2021 61.8% retrace as the EURO STOXX 50 challenges range support and the 200-day moving average. Deteriorating risky market sentiment into a bearish seasonal period and the recent pattern development on the EUR/USD chart leave us looking for further dollar strength into the fall.
GBP/USD continues to trade in a potential head-and-shoulders top pattern above 1.2546-1.2632 support and below 1.30-1.31 resistance. This week’s deterioration in global risky markets increases conviction in the bearish cable outlook. Look for a breakdown to initially target 1.2344-1.2379.
USD/JPY continued its rally and its test of the 146.705 Sep 2022 78.6% retrace invalidates the pair could form a top below resistance in the low- to mid-140s. Until a clear top pattern develops, bulls keep the agenda while above the 141.32-142.32 support cluster.
AUD/USD extends the slide to the 0.6382 Oct 2022 78.6% retrace. Bears keep the agenda while below the 0.6617 Aug 10 high and 0.669-0.6734 moving averages. A retest of the 0.617 Oct 2022 low in the weeks ahead possible.
ECO
- Monday – EUR PPI, Chicago Fed activity index, CAD new housing px, US 3-mth & 6 mth bill auction, Thai GDP, S.Korea Consumer sentimen.
- Tuesday – CHF trade bal, EU Current Ac, US existing home sales, Fed Bowman speech, Fed Goolsbee Speech, US crude stock, NZD retail sales, AUD PMI, S.Korea Manufacturing BSg
- Wednesday – Japan Jibun PMI, UK S&P/CIPS PMIs, CAD retail sales, US PMI, EU Consumer conf, US Crude EIA stock chg , Sing CPI, S.Korea PPg
- Thursday – US initial job claims, US Durable orders, Jackson hole, Jap CPI, BOK i/r decision, BoI i/3
- Friday – US Michigan Consumer Sentiment Index(Aug), Powell speech, Sing Industrial prod, India Bank loan growth, India FX reserves
Sources – Various news outlets including Bloomberg, Reuters, Financial Times, FactSet, Associated Press
Disclaimer: The law allows us to give general advice or recommendations on the buying or selling of any investment product by various means (including the publication and dissemination to you, to other persons or to members of the public, of research papers and analytical reports). We do this strictly on the understanding that:
(i) All such advice or recommendations are for general information purposes only. Views and opinions contained herein are those of Bordier & Cie. Its contents may not be reproduced or redistributed. The user will be held fully liable for any unauthorised reproduction or circulation of any document herein, which may give rise to legal proceedings.
(ii) We have not taken into account your specific investment objectives, financial situation or particular needs when formulating such advice or recommendations; and
(iii) You would seek your own advice from a financial adviser regarding the specific suitability of such advice or recommendations, before you make a commitment to purchase or invest in any investment product. All information contained herein does not constitute any investment recommendation or legal or tax advice and is provided for information purposes only.
In line with the above, whenever we provide you with resources or materials or give you access to our resources or materials, then unless we say so explicitly, you must note that we are doing this for the sole purpose of enabling you to make your own investment decisions and for which you have the sole responsibility.
© 2020 Bordier Group and/or its affiliates.